Director of Policy Research and Engagement
The National Flood Insurance Program (NFIP) is the predominant provider of flood insurance nationally. Communities across the country can voluntarily join the program. In exchange for their residents being able to purchase federal flood policies, they must adopt minimum floodplain management regulations. The program has grown since its founding in 1968 and now writes nearly 5 million policies throughout the U.S.
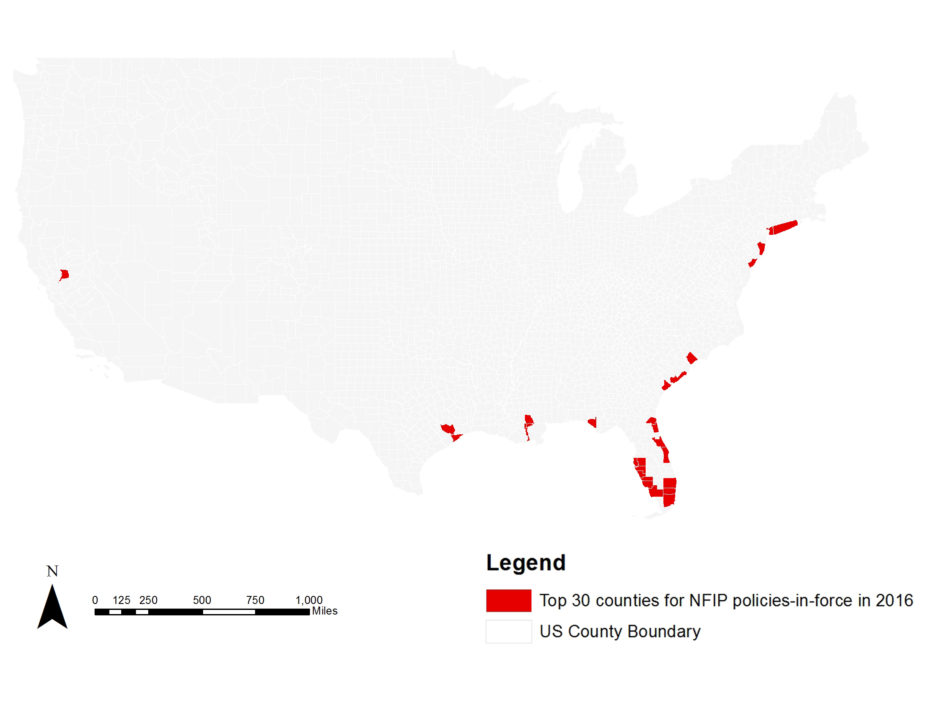
These policies, however, are not distributed evenly geographically: the NFIP is a highly concentrated program. The 30 counties with the greatest numbers of policies as of July 2017 are responsible for 51% percent of total policies nationwide (data here). So roughly 1% of counties in the U.S. account for over half of NFIP policies. Figure 1 shows these counties in red. Not surprisingly, they are concentrated in areas of very high flood risk, such as Florida, along the East Coast, and in and around cities with high flood risk including Sacramento, Houston, and New Orleans.
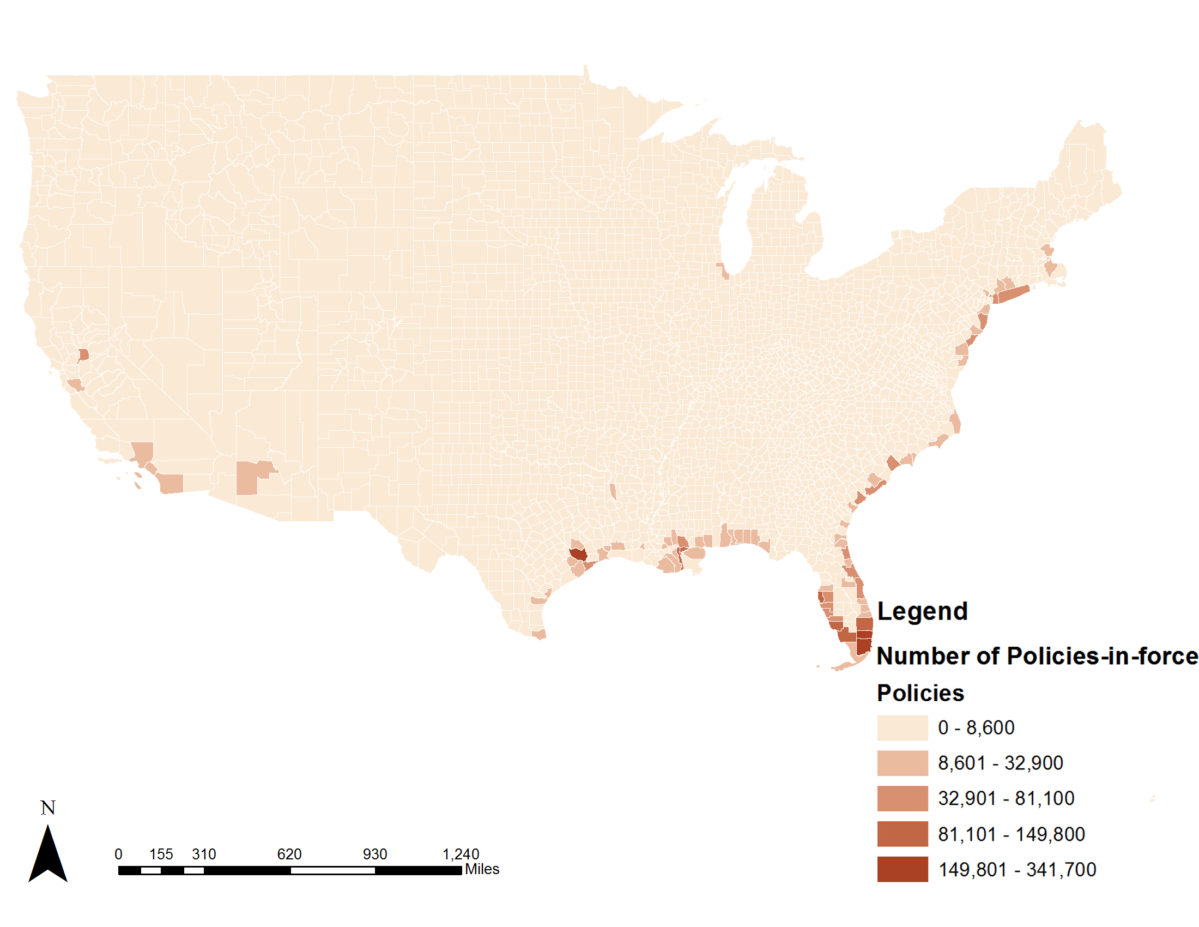
While the genesis of the program grew in part from concern over river flooding, the NFIP is now heavily exposed to coastal flood risk. Figure 2 shows counties by the number of policies-in-force as of the summer of 2017. The concentration in Florida, the east coast through the Mid-Atlantic, and the Gulf Coast is evident.
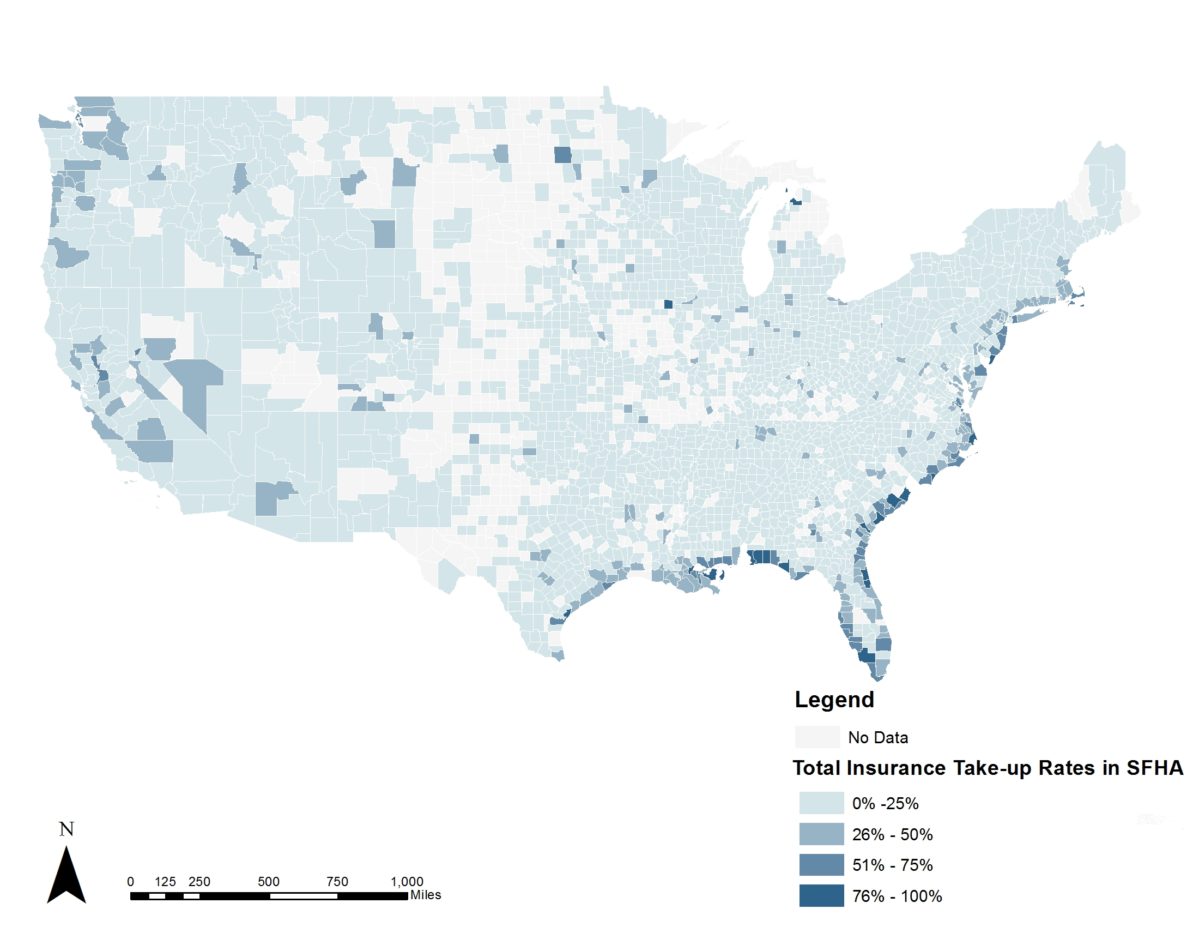
Maps of total policy counts, however, are not scaled for the number of people at risk. FEMA has produced estimates nationwide for the percent of homes in FEMA-mapped 100-year floodplains—called Special Flood Hazard Areas (SFHAs)—that have a flood insurance policy (data from August 2016). This is shown in Figure 3. Two findings emerge from Figure 3. First, beyond coastal counties, there are areas around the country where take-up rates in 100-year floodplains are high. But the figure also shows that in very few counties does purchase of flood insurance in the 100-year floodplain exceed 75% of households and these are largely coastal counties. In most places, take-up rates for flood insurance are fairly low, even in FEMA-mapped high risk areas.
Given the heavy concentration of polices, it is not surprising that analysts have found that claims are heavily concentrated as well. Previous research from the Wharton Risk Center confirms that claims have been concentrated in areas where hurricanes have hit and where there are many policies. That work also showed, however, that claims as a percentage of building value are not so heavily concentrated, indicating that damaging floods can happen all around the country.
Recent flood events again vividly demonstrated that flooding often occurs outside the mapped 100-year floodplain, whether from more severe events, outdated maps, or stormwater flooding not accurately captured on FEMA flood maps. Historically, around 30% of claims are outside the SFHA. Given the important role disaster insurance plays in promoting household recovery and resiliency, it is worth considering how to expand flood coverage more fully across the country.
* Thanks to the NAR research team for their data analysis and thanks to Xiao Wu for excellent research assistance.